Cloud Emojis: Price Interaction with Momentum Boundaries
Cloud Emojis: Price Interaction with Momentum Boundaries
In the VOLMIKE.COM system, we constantly seek ways to bridge the gap between the raw price action and the underlying momentum dynamics revealed by Volatility Mike. Our Cloud Emojis serve this precise purpose, providing a continuous, real-time visual insight into how price is interacting with the critical boundaries established by Mike's Tom DeMark Supply and Demand Lines.
These emojis allow for a quick, intuitive understanding of whether the market is pushing beyond established momentum-based thresholds.
The Mike TD Supply and Demand Lines (Brief Recap)
As discussed, Mike TD Supply and Demand lines are dynamic levels calculated based on Mike's price action. They represent areas where buying or selling pressure is likely to be concentrated in terms of momentum. They adapt continuously throughout the trading day.
The Cloud Emojis: Visualizing Boundary Interaction
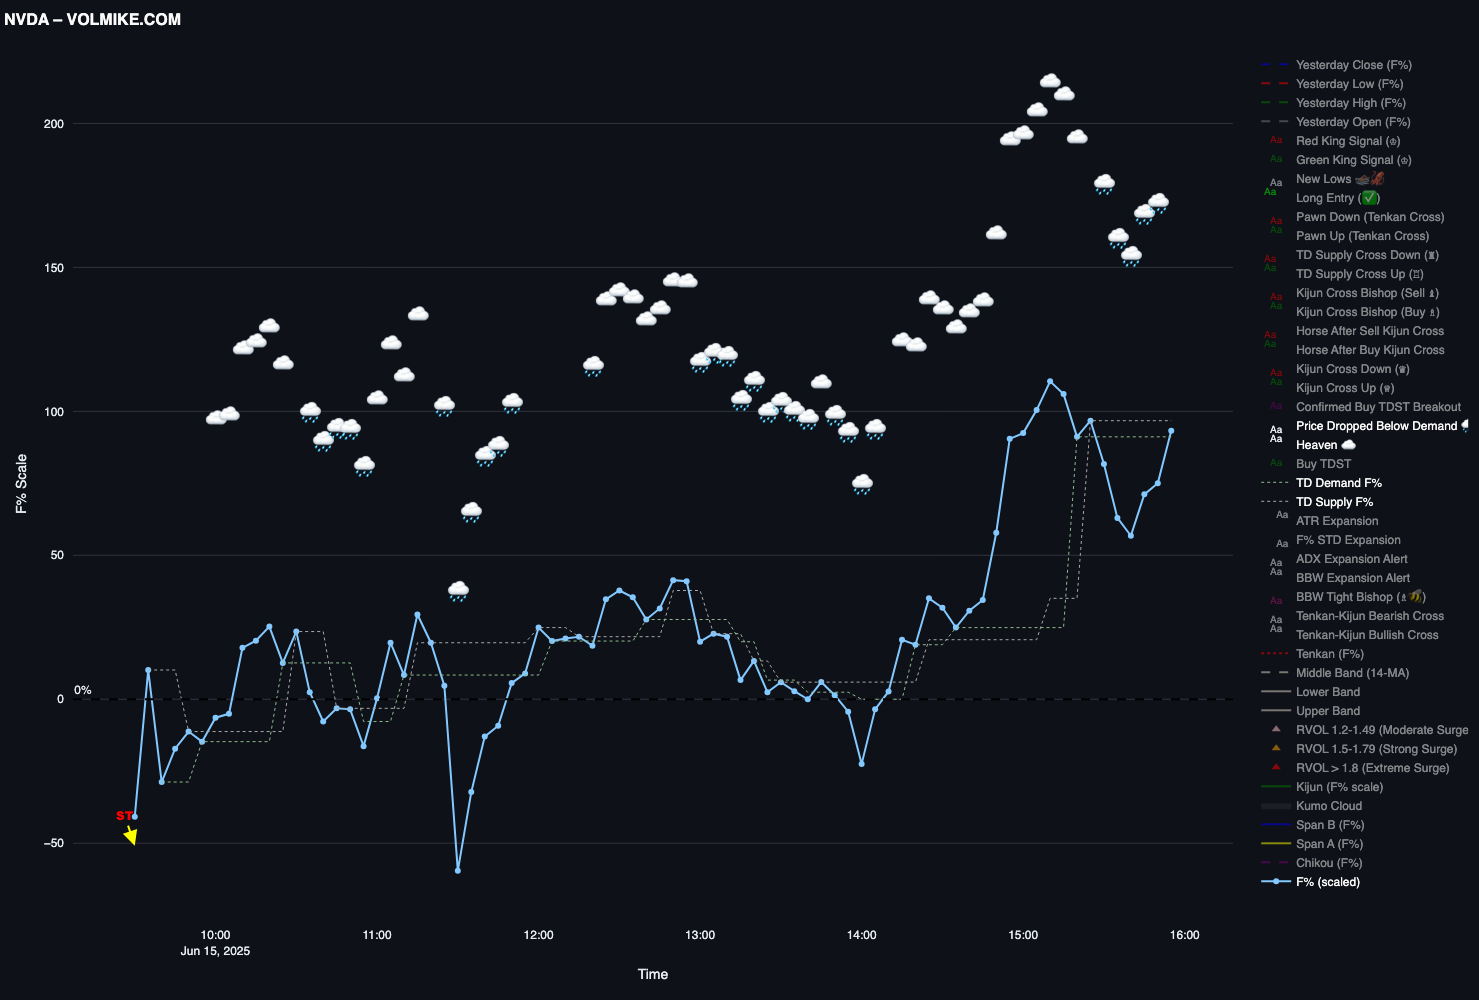
The Cloud Emojis appear continuously on the plot, providing instant visual feedback:
-
☀️ Sunny Cloud:
- Appearance: A Sunny Cloud emoji appears when the current price is trading above the Mike TD Supply line.
- Meaning: This signals that price is pushing beyond a significant overhead resistance level that was defined by Mike's supply-side momentum. It indicates strong upward pressure and a bullish breach of a key boundary.
-
🌧️ Rainy Cloud:
- Appearance: A Rainy Cloud emoji appears when the current price is trading below the Mike TD Demand line.
- Meaning: This signals that price is pushing below a significant support level that was defined by Mike's demand-side momentum. It indicates strong downward pressure and a bearish breach of a key boundary.
These emojis are plotted continuously on the chart, offering a real-time visual cue about whether the actual price is respecting or decisively breaking through momentum-derived boundaries.
Interpretation: What the Clouds Tell Us
The Cloud Emojis are not necessarily reversal signals in themselves, but rather powerful confirmations of boundary breaches and directional conviction.
- A Sunny Cloud confirms that bulls are pushing price through areas of supply, aligning with strong positive momentum.
- A Rainy Cloud confirms that bears are driving price through areas of demand, aligning with strong negative momentum.
They offer a simplified, intuitive insight into the context of price action relative to Mike's dynamic boundaries, allowing for rapid decision-making in fast-moving markets.
Importance for Marengo Setups
The Cloud Emojis are crucial for our "Marengo" setups as they provide immediate visual confirmation of whether the raw price is successfully moving beyond critical momentum-based thresholds.
- During a North Marengo, the presence of a Sunny Cloud adds a powerful layer of validation, indicating that the bullish momentum (signaled by Mike) is translating into real price breaches of resistance.
- During a South Marengo, a Rainy Cloud confirms that the bearish momentum is pushing price through support, signaling a highly convicted breakdown.
These emojis ensure that we quickly grasp the full picture of price, momentum, and conviction, making them indispensable for identifying and confirming high-probability "Marengo" opportunities.